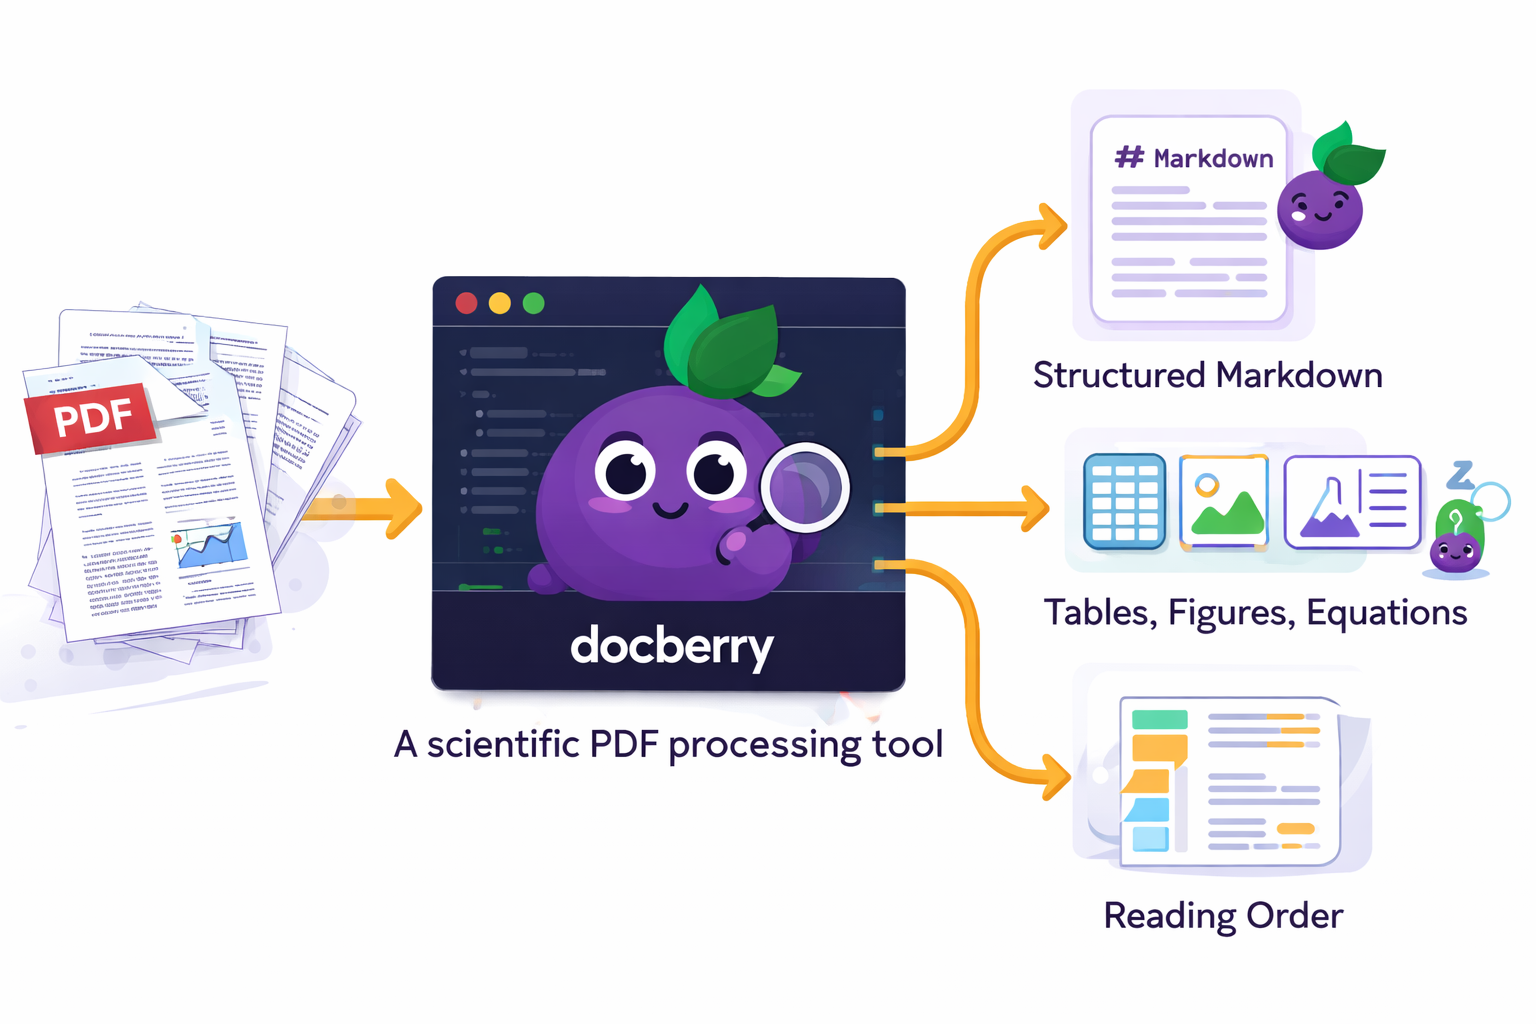
Scientific PDFs to
structured Markdown

Extract tables, figures, and equations from academic papers with proper reading order — powered by Docling, enhanced with multi-column segmentation and pluggable equation enrichment.

$ pip install docberry Copied!

Two-stage pipeline

DocBerry first segments multi-column layouts into reading order, then converts to Markdown with full asset extraction.

DocBerry pipeline — PDF to Structured Markdown, Tables, Figures, Equations, and Reading Order

See it in action

Real outputs from a scientific paper processed by DocBerry.

Segmentation

Reading Order Detection

DocBerry analyzes each page and detects full-width regions (title, abstract, figures) and two-column body text. Color-coded segments show the detected layout: green for full-width, orange for left column, blue for right column. The segments are reordered into the natural reading sequence before conversion.

Page segmentation showing detected layout regions Page 1 — Title + two-column body detected
Segmentation

Two-Column Detection

Interior pages with pure two-column text are split into left and right segments. Equations and section headings that sit within a column are kept with their column. The algorithm handles narrow gutters, mixed single/double regions, and figures that span one or both columns.

Two-column page detection Page 3 — Pure two-column body with equations
Table Extraction

High-Fidelity Tables

Every table is extracted as a high-DPI image (900 DPI) in PNG, PDF, and SVG formats, plus a structured CSV. The Markdown output replaces pipe-delimited tables with image hyperlinks so you can always verify the extraction against the original rendering.

Extracted table at 900 DPI Table 1 — Extracted at 900 DPI with CSV + caption
Figure Extraction

Figures with Captions

Figures are extracted with their captions preserved alongside. Sub-figures that span multiple panels are intelligently merged into a single composite asset. Complex multi-panel figures with embedded charts and confusion matrices are captured faithfully.

Extracted multi-panel figure Figure 2 — Pipeline diagram extracted with full fidelity
Figure Extraction

Complex Composite Figures

Even complex full-page composite figures with tables, scatter plots, density charts, heatmaps, and confusion matrices are captured as a single unified asset. Captions are preserved and saved alongside the image files.

Complex composite figure with multiple chart types Figure 3 — Table + charts + heatmaps in one composite
Equation Enrichment

Equations to LaTeX

Every equation is saved as a high-DPI image and optionally converted to LaTeX using one of four backends. The Markdown output includes both the LaTeX block and an image reference so you can visually verify each equation.

Extracted equation 1
Equation 1 — Saved as image + LaTeX text file

One-Shot Pipeline

Use auto_segment=True to segment and convert in a single call. Or run each stage independently for full control.

🧩

Modular Extras

Install only what you need. Core is lightweight; pix2tex and Qwen are optional extras. Models auto-download on first use.

📄

Multi-Format Output

Every asset in PNG + PDF + SVG. Tables also get CSV. Equations get LaTeX .txt files. Captions preserved for all assets.

Up and running in seconds

Use the Python API or the CLI — your choice.

from docberry import segment_pdf, convert_document

# One-shot: segment + convert in a single call
result = convert_document(
    "paper.pdf",
    output_dir="output/",
    extract_assets=True,
    auto_segment=True,
    equation_enrichment="pix2tex",
)

print(result.markdown_path)    # output/paper.md
print(result.tables)           # 5
print(result.figures)          # 8
print(result.equations)        # 12
print(result.elapsed_seconds)  # 42.3
# Full pipeline (segment + convert)
$ docberry convert paper.pdf -o output/ --extract-assets --auto-segment

# With equation enrichment
$ docberry convert paper.pdf -o output/ --extract-assets \
    --equation-enrichment pix2tex

# Segment only (for inspection)
$ docberry segment paper.pdf -o paper_segmented.pdf --debug-dir overlays/

# Pre-download all model weights
$ docberry download-models --all
# Core (segmentation + conversion + asset extraction)
$ pip install docberry

# With lightweight equation LaTeX OCR
$ pip install 'docberry[pix2tex]'

# With Qwen VLM equation enrichment
$ pip install 'docberry[qwen]'

# Everything
$ pip install 'docberry[all]'

Equation enrichment backends

Choose the right trade-off between speed, quality, and model size.

Method Speed Quality Model Size Install Extra
none Images only (no LaTeX)
pix2tex Fast ~1s/eq Good for simple equations ~100 MB docberry[pix2tex]
qwen Medium ~3s/eq Good, handles complex notation ~1.6 GB docberry[qwen]
docling Slow ~5s/eq High (CodeFormulaV2 VLM) ~2 GB Built-in

API Reference

The two main functions you’ll use.

convert_document(...) → ConversionResult

Convert a document to Markdown or JSON with optional asset extraction. This is the main entry point for DocBerry.

ParameterTypeDefaultDescription
source str Path to a local file or a URL to convert.
output_dir str | None None Output directory. Defaults to <source_stem>_output/ next to the source.
output_format str "markdown" "markdown" or "json".
extract_assets bool True Extract tables, figures, and equations as separate image files.
layout_model str "heron" Docling layout model. Options: "heron", "egret-medium", "egret-large", "egret-xlarge".
pipeline str "standard" Conversion pipeline: "standard" or "vlm".
equation_enrichment str "none" LaTeX extraction method: "none", "pix2tex", "qwen", or "docling".
auto_segment bool False Segment the PDF for reading order before conversion.
segment_pdf(...) → List[Segment]

Segment a PDF into reading-order regions. Detects full-width headers, two-column body, and spanning figures/tables, then writes each region as a separate page.

ParameterTypeDefaultDescription
input_pdf str Path to the source PDF file.
output_pdf str "segmented_output.pdf" Path for the segmented output PDF.
page_spec str | None None Page range (0-based), e.g. "0,2-4". All pages if None.
debug_dir str | None None Directory for debug overlay images (requires docberry[debug]).
config LayoutConfig | None None Layout tuning parameters. Uses defaults if None.
ConversionResult

Dataclass returned by convert_document().

FieldTypeDescription
markdown_pathPath | NonePath to the generated Markdown file.
json_pathPath | NonePath to the generated JSON file.
output_dirPath | NoneOutput directory containing all results.
tablesintNumber of tables extracted.
figuresintNumber of figures extracted.
equationsintNumber of equations extracted.
elapsed_secondsfloatTotal processing time in seconds.

CLI Reference

Three subcommands for every workflow.

docberry convert Main
FlagDefaultDescription
sourcePath or URL of the document to convert.
-o, --output-dirautoOutput directory.
--formatmarkdownOutput format: markdown or json.
--extract-assetsoffExtract tables, figures, equations as images.
--auto-segmentoffSegment for reading order first.
--layout-modelheronLayout model: heron, egret-medium, egret-large, egret-xlarge.
--pipelinestandardPipeline: standard or vlm.
--equation-enrichmentnoneLaTeX method: none, pix2tex, qwen, docling.
docberry segment Layout
FlagDefaultDescription
inputInput PDF path.
-o, --outputsegmented_output.pdfOutput segmented PDF path.
--pagesallPage spec, 0-based (e.g. 0,2-4).
--debug-dirDirectory for debug overlay images.
--line-merge-gap3.0Gap to merge text lines vertically.
--band-merge-gap14.0Gap to merge adjacent bands.
--single-coverage-threshold0.68X-coverage to classify a band as single-column.
--min-side-coverage0.55Min occupancy to consider a column side active.
--min-center-gap-ratio0.08Min center gap ratio for double-column detection.
--caption-merge-gap35.0Max gap to merge a caption into its figure/table.
docberry download-models Setup
FlagDescription
--allDownload all model weights (Docling + pix2tex + Qwen).
--pix2texDownload pix2tex model weights only (~100 MB).
--qwenDownload Qwen3.5-0.8B model weights (~1.6 GB).

Frequently Asked Questions

Common questions about DocBerry.

Does DocBerry work on single-column papers?

Yes. The segmentation step detects whether pages are single or multi-column. Single-column pages pass through without modification. You can also skip segmentation entirely by omitting --auto-segment.

Is a GPU required?

No. The core pipeline (segmentation + conversion + asset extraction) runs on CPU. However, equation enrichment with qwen or docling benefits significantly from a GPU. The pix2tex backend is lightweight and runs fine on CPU.

What file formats are supported as input?

DocBerry supports all formats that Docling supports: PDF, DOCX, HTML, PPTX, and images. The segmentation feature is specific to PDFs. For other formats, use convert_document() without auto_segment.

What DPI are extracted images?

All images (tables, figures, equations) are extracted at 900 DPI in three formats: PNG, PDF, and SVG. This ensures sharp rendering even when zooming in.

Which equation enrichment backend should I use?

For quick results with simple equations, use pix2tex (~1 sec/eq, ~100 MB). For complex notation with subscripts and matrices, use qwen (~3 sec/eq, ~1.6 GB). For highest quality with Docling’s built-in VLM, use docling (~5 sec/eq, ~2 GB). If you just need equation images without LaTeX, use none.

Can I use only segmentation without conversion?

Yes. Use docberry segment paper.pdf -o segmented.pdf on the CLI or segment_pdf("paper.pdf") in Python. The segmented PDF can then be fed into any other tool that expects proper reading order.

How do I tune segmentation for a specific layout?

Use --debug-dir overlays/ to visualize detected segments. Then adjust parameters like --single-coverage-threshold, --min-center-gap-ratio, or --caption-merge-gap via the CLI or a LayoutConfig object in Python.

Clean, organized results

Every table, figure, and equation is saved in multiple formats with captions and LaTeX text. The Markdown links directly to each asset.

PNG + PDF + SVG for every image asset.
CSV for tables. LaTeX .txt for equations.
Captions preserved alongside each asset.

output/
  paper.md
  tables/
    table-1.png / .pdf / .svg
    table-1.csv
    table-1_caption.txt
  figures/
    figure-1.png / .pdf / .svg
    figure-1_caption.txt
  equations/
    equation-1.png / .pdf / .svg
    equation-1_latex.txt